
ACQUISITION
Know what a new customer really costs.
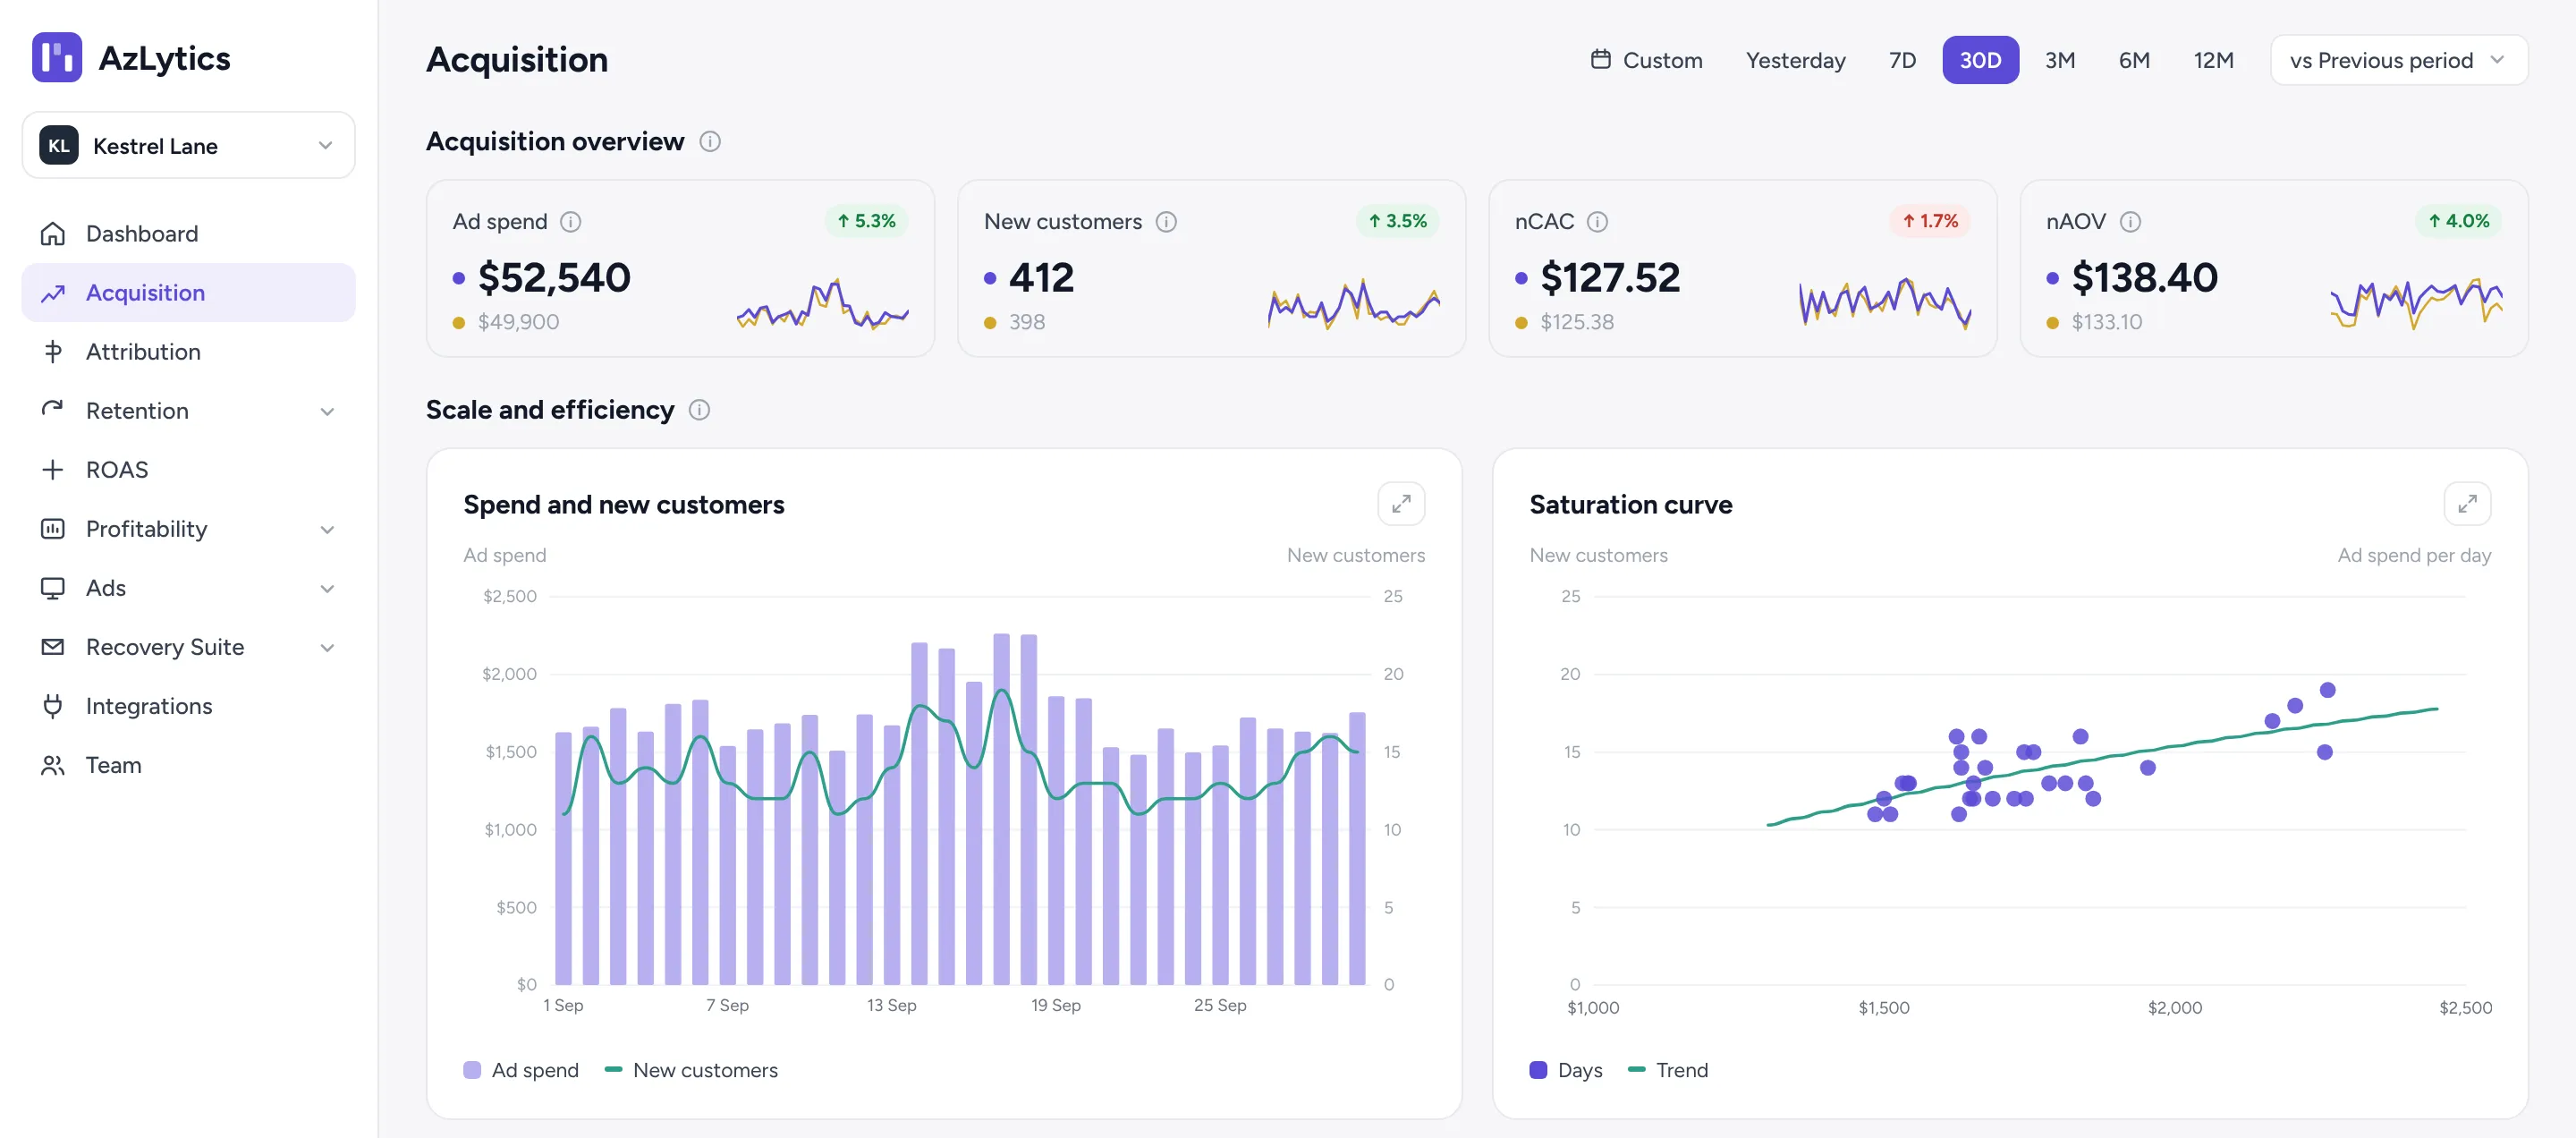
Ad spend, new customers, nCAC and first-order sales in one view, from your Shopify orders and your ad accounts. See when more spend stops bringing in more customers.
- nCAC and first-order value, against last period
- Each day’s spend plotted against new customers
- What the first order earns, next to what it cost
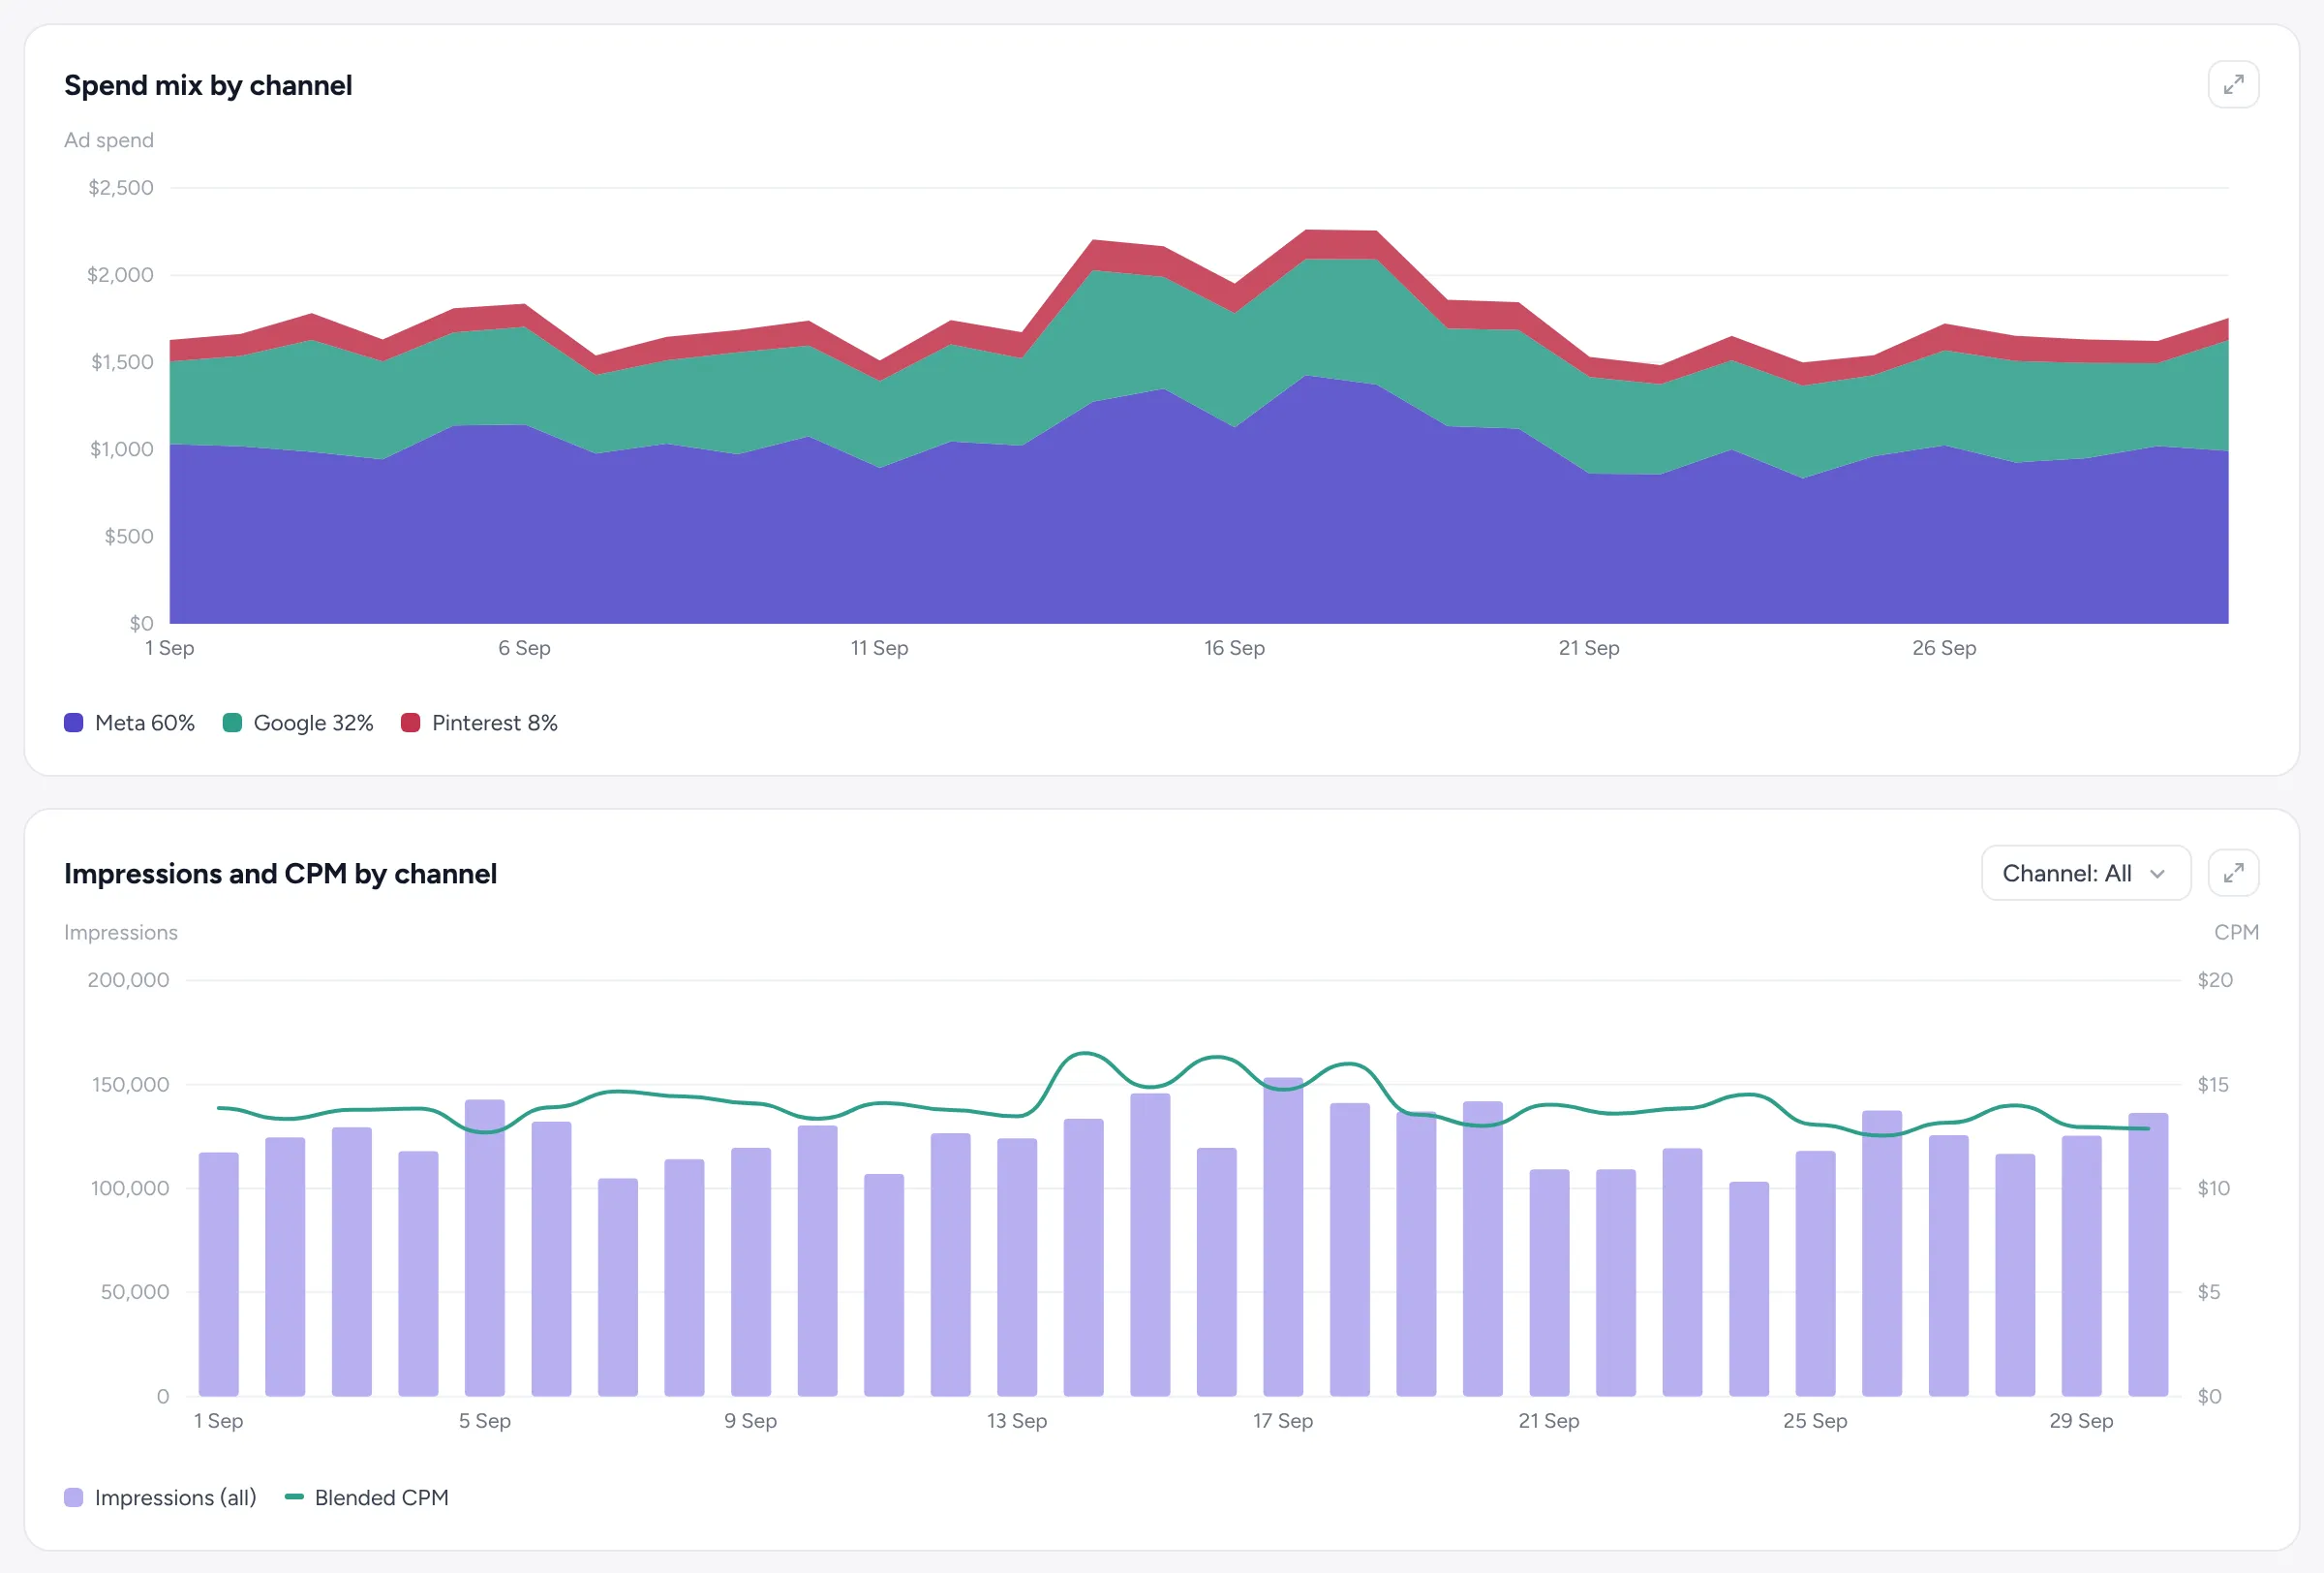
- Spend, CPM, CTR and CPC by ad platform
30-day free trial · No sales call · No developer · Cancel any time
SOUND FAMILIAR?
Spend is up. Are new customers?
Ad platforms count conversions. Your growth depends on first-time buyers.
THE PROBLEM
Meta reports more conversions, but how many were new customers?
WITH AZLYTICS
New customers come from your Shopify orders, so nCAC is your spend divided by real first-time buyers.
THE PROBLEM
You raised the budget. New customers didn’t follow.
WITH AZLYTICS
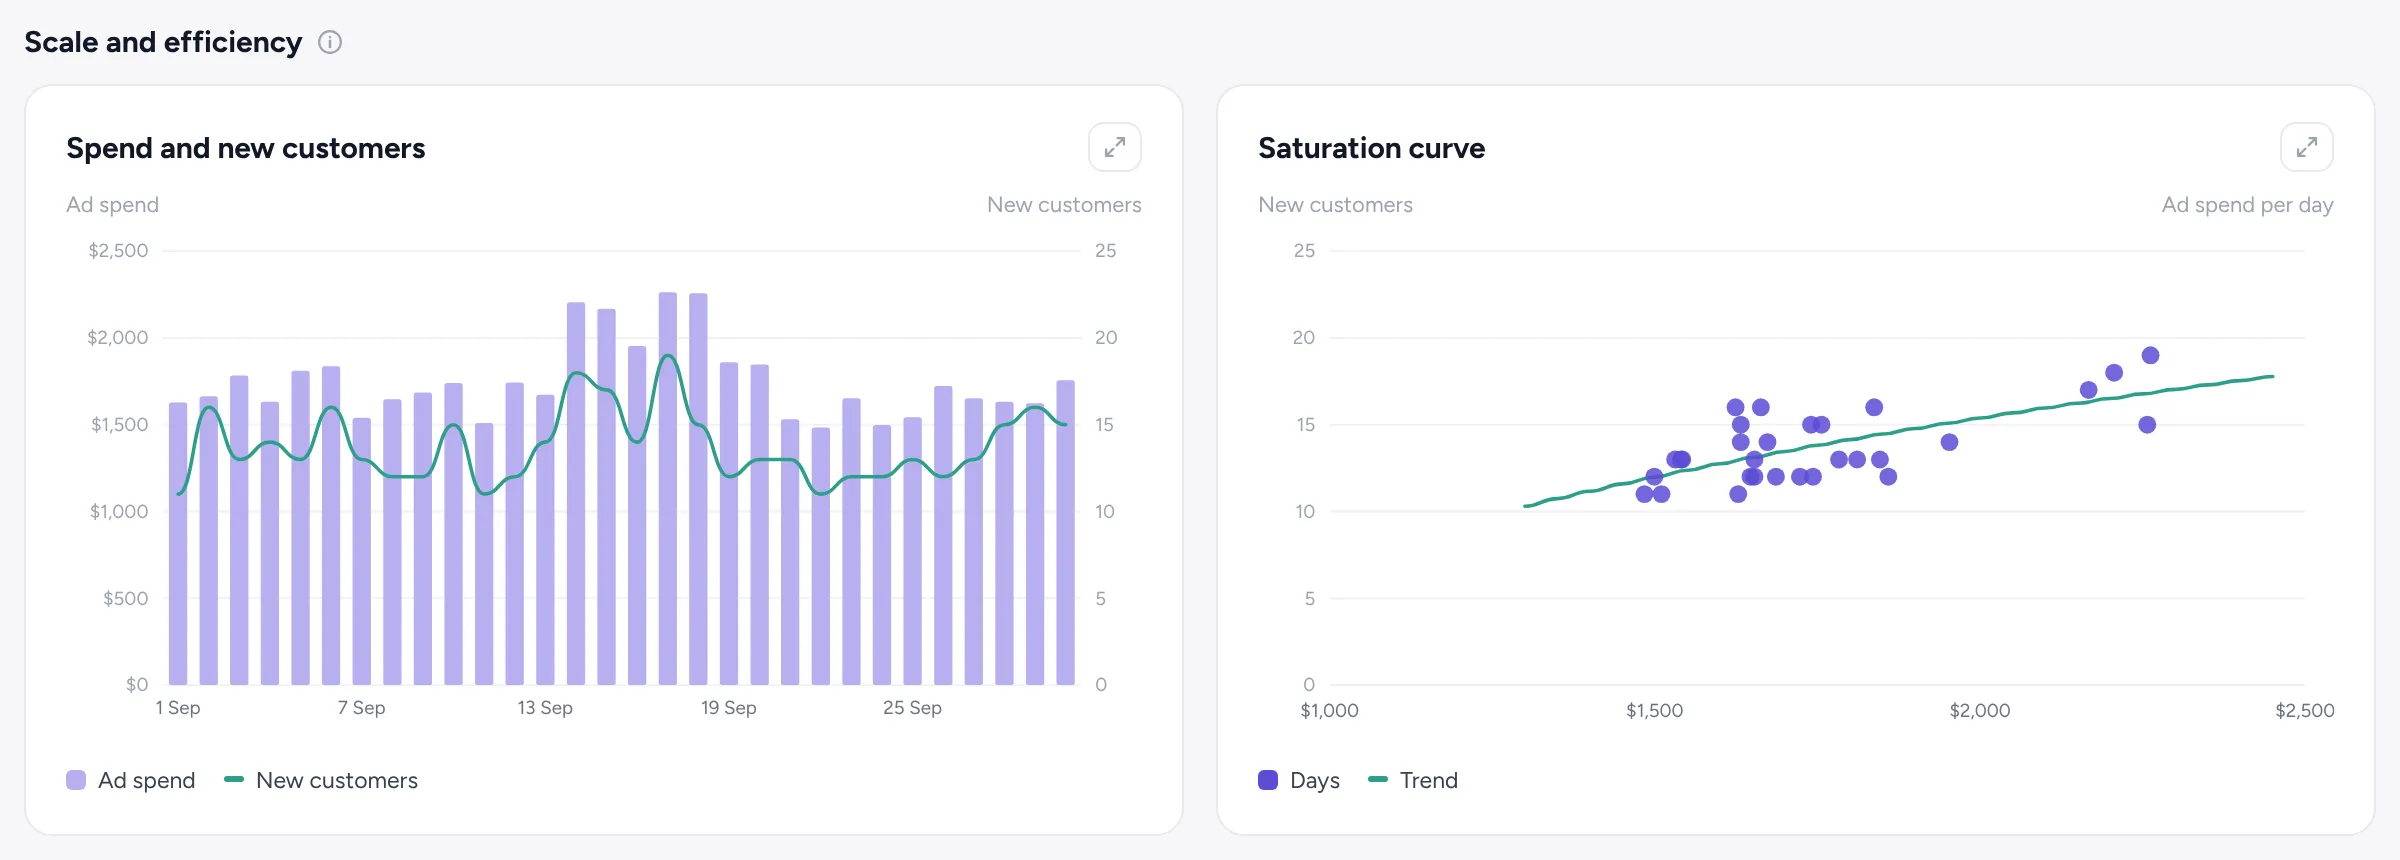
The saturation chart puts each day’s spend against that day’s new customers, so you see when extra spend stops buying more.
THE PROBLEM
The first order loses money, and you can’t tell if that’s okay.
WITH AZLYTICS
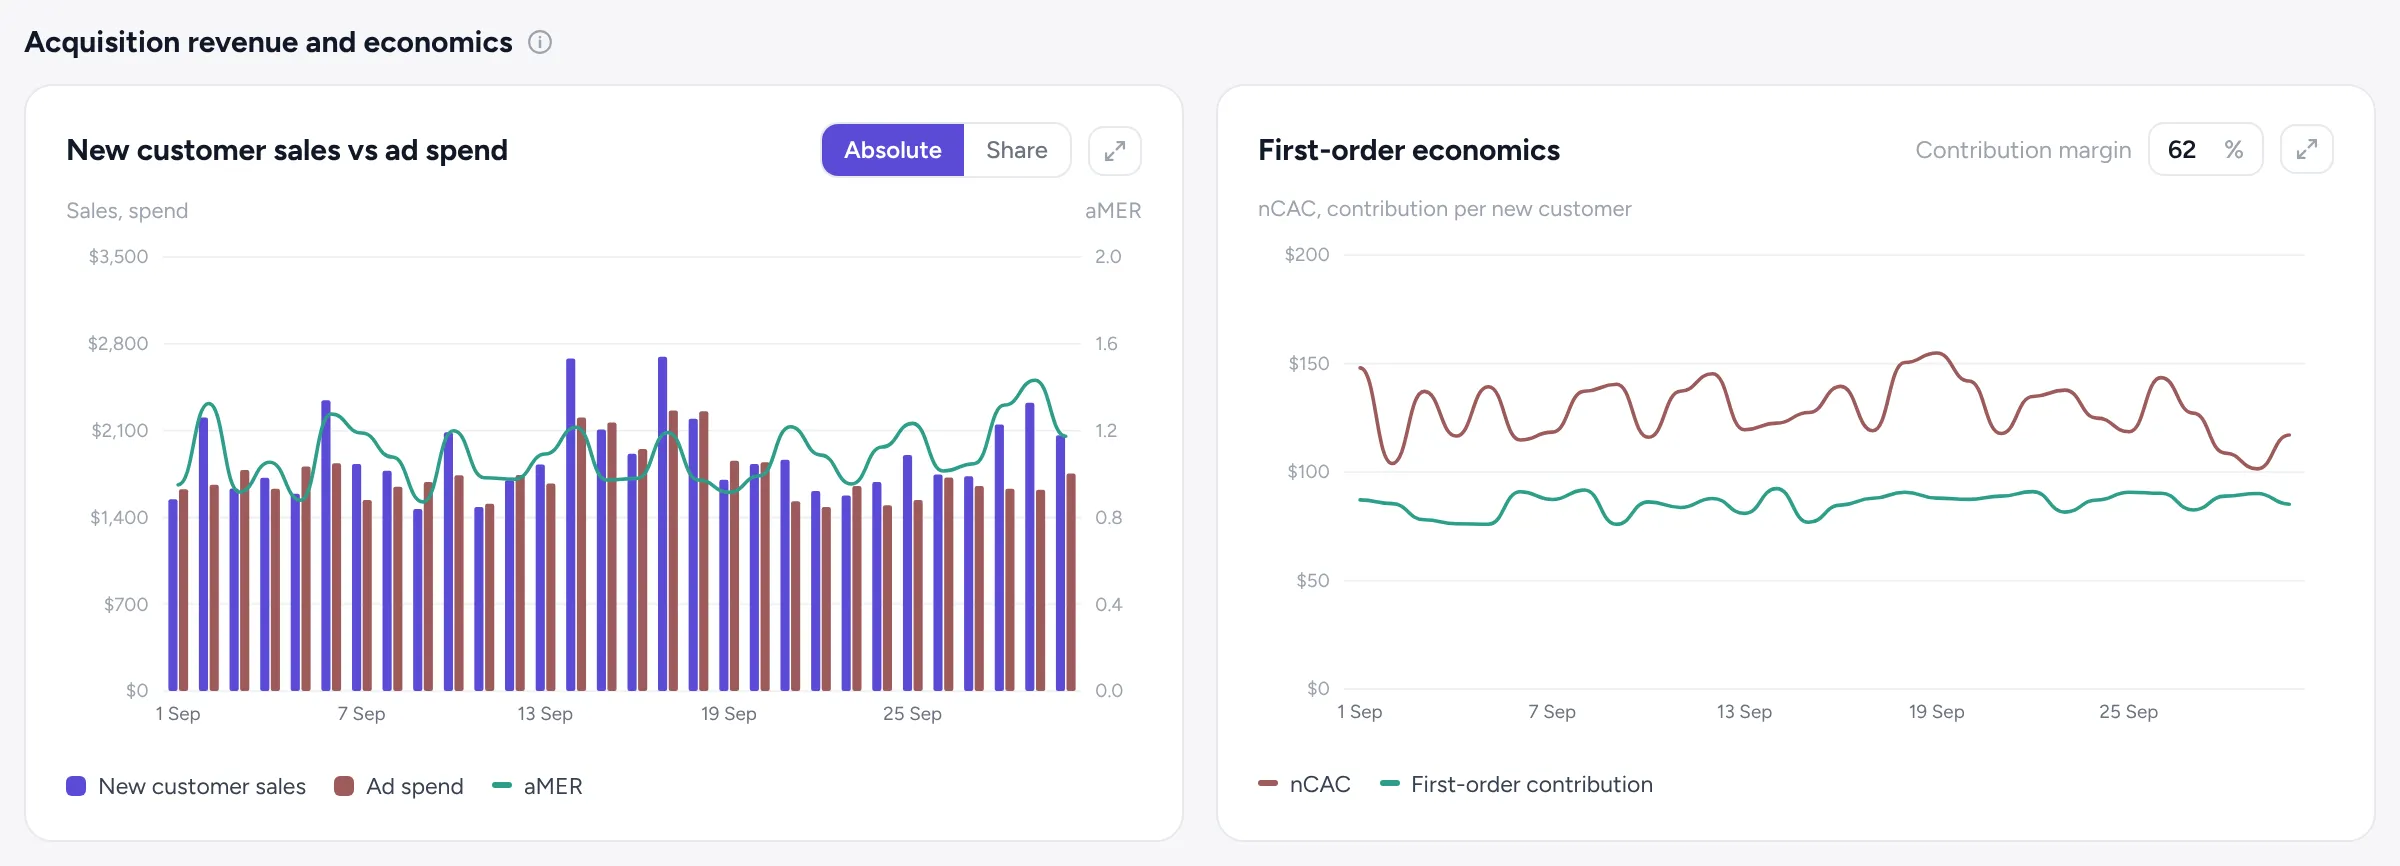
First-order economics puts what the first order earns next to nCAC. Retention then shows when those customers pay you back.
THE NUMBERS
Four numbers that tell you if growth is healthy.
Each one sits next to the previous period, so you see what changed.
Ad spend
What you spent on Meta, Google, Pinterest and TikTok ads.
New customers
First-time buyers, from your Shopify orders.
nCAC
Marketing spend ÷ new customers. What each first-time buyer cost.
nAOV
The average first order of a new customer.
SCALE
Spend more only while it still buys customers.
Daily ad spend next to daily new customers, and a saturation chart with one dot per day. When the dots stop climbing as spend goes up, the extra budget isn’t buying new customers.
FIRST ORDER
Know what the first order earns you.
New-customer sales against ad spend, with aMER (revenue from new customers ÷ total ad spend) for every day. First-order economics puts nCAC next to what each first order contributes, at the margin you set.
CHANNELS
See which platform takes the budget.
Spend mix by ad platform, impressions and CPM, and CTR and CPC for each channel. Spot the day your costs jumped, and on which platform.
Acquisition questions
What is nCAC?
New customer acquisition cost: marketing spend ÷ new customers. It tells you what each first-time buyer cost you.
What is aMER?
Revenue from new customers ÷ total ad spend. Unlike the ROAS an ad platform reports, it uses your Shopify sales.
How does AzLytics know who is a new customer?
From your Shopify orders. A new customer is someone placing their first order with your store.
Which ad platforms are included?
Meta Ads, Google Ads, Pinterest Ads and TikTok Ads. You can connect several ad accounts per platform.
What does the saturation chart show?
Each dot is one day: what you spent and how many new customers you got. The trend line shows how new customers move as spend goes up.
See what your last 100 new customers really cost.
Acquisition sits next to Profit, Attribution, Recovery Suite and Retention in one Shopify app.
Start free trial on Shopify30-day free trial · No sales call · No developer · Cancel any time