
RETENTION
Know what a new customer is really worth.
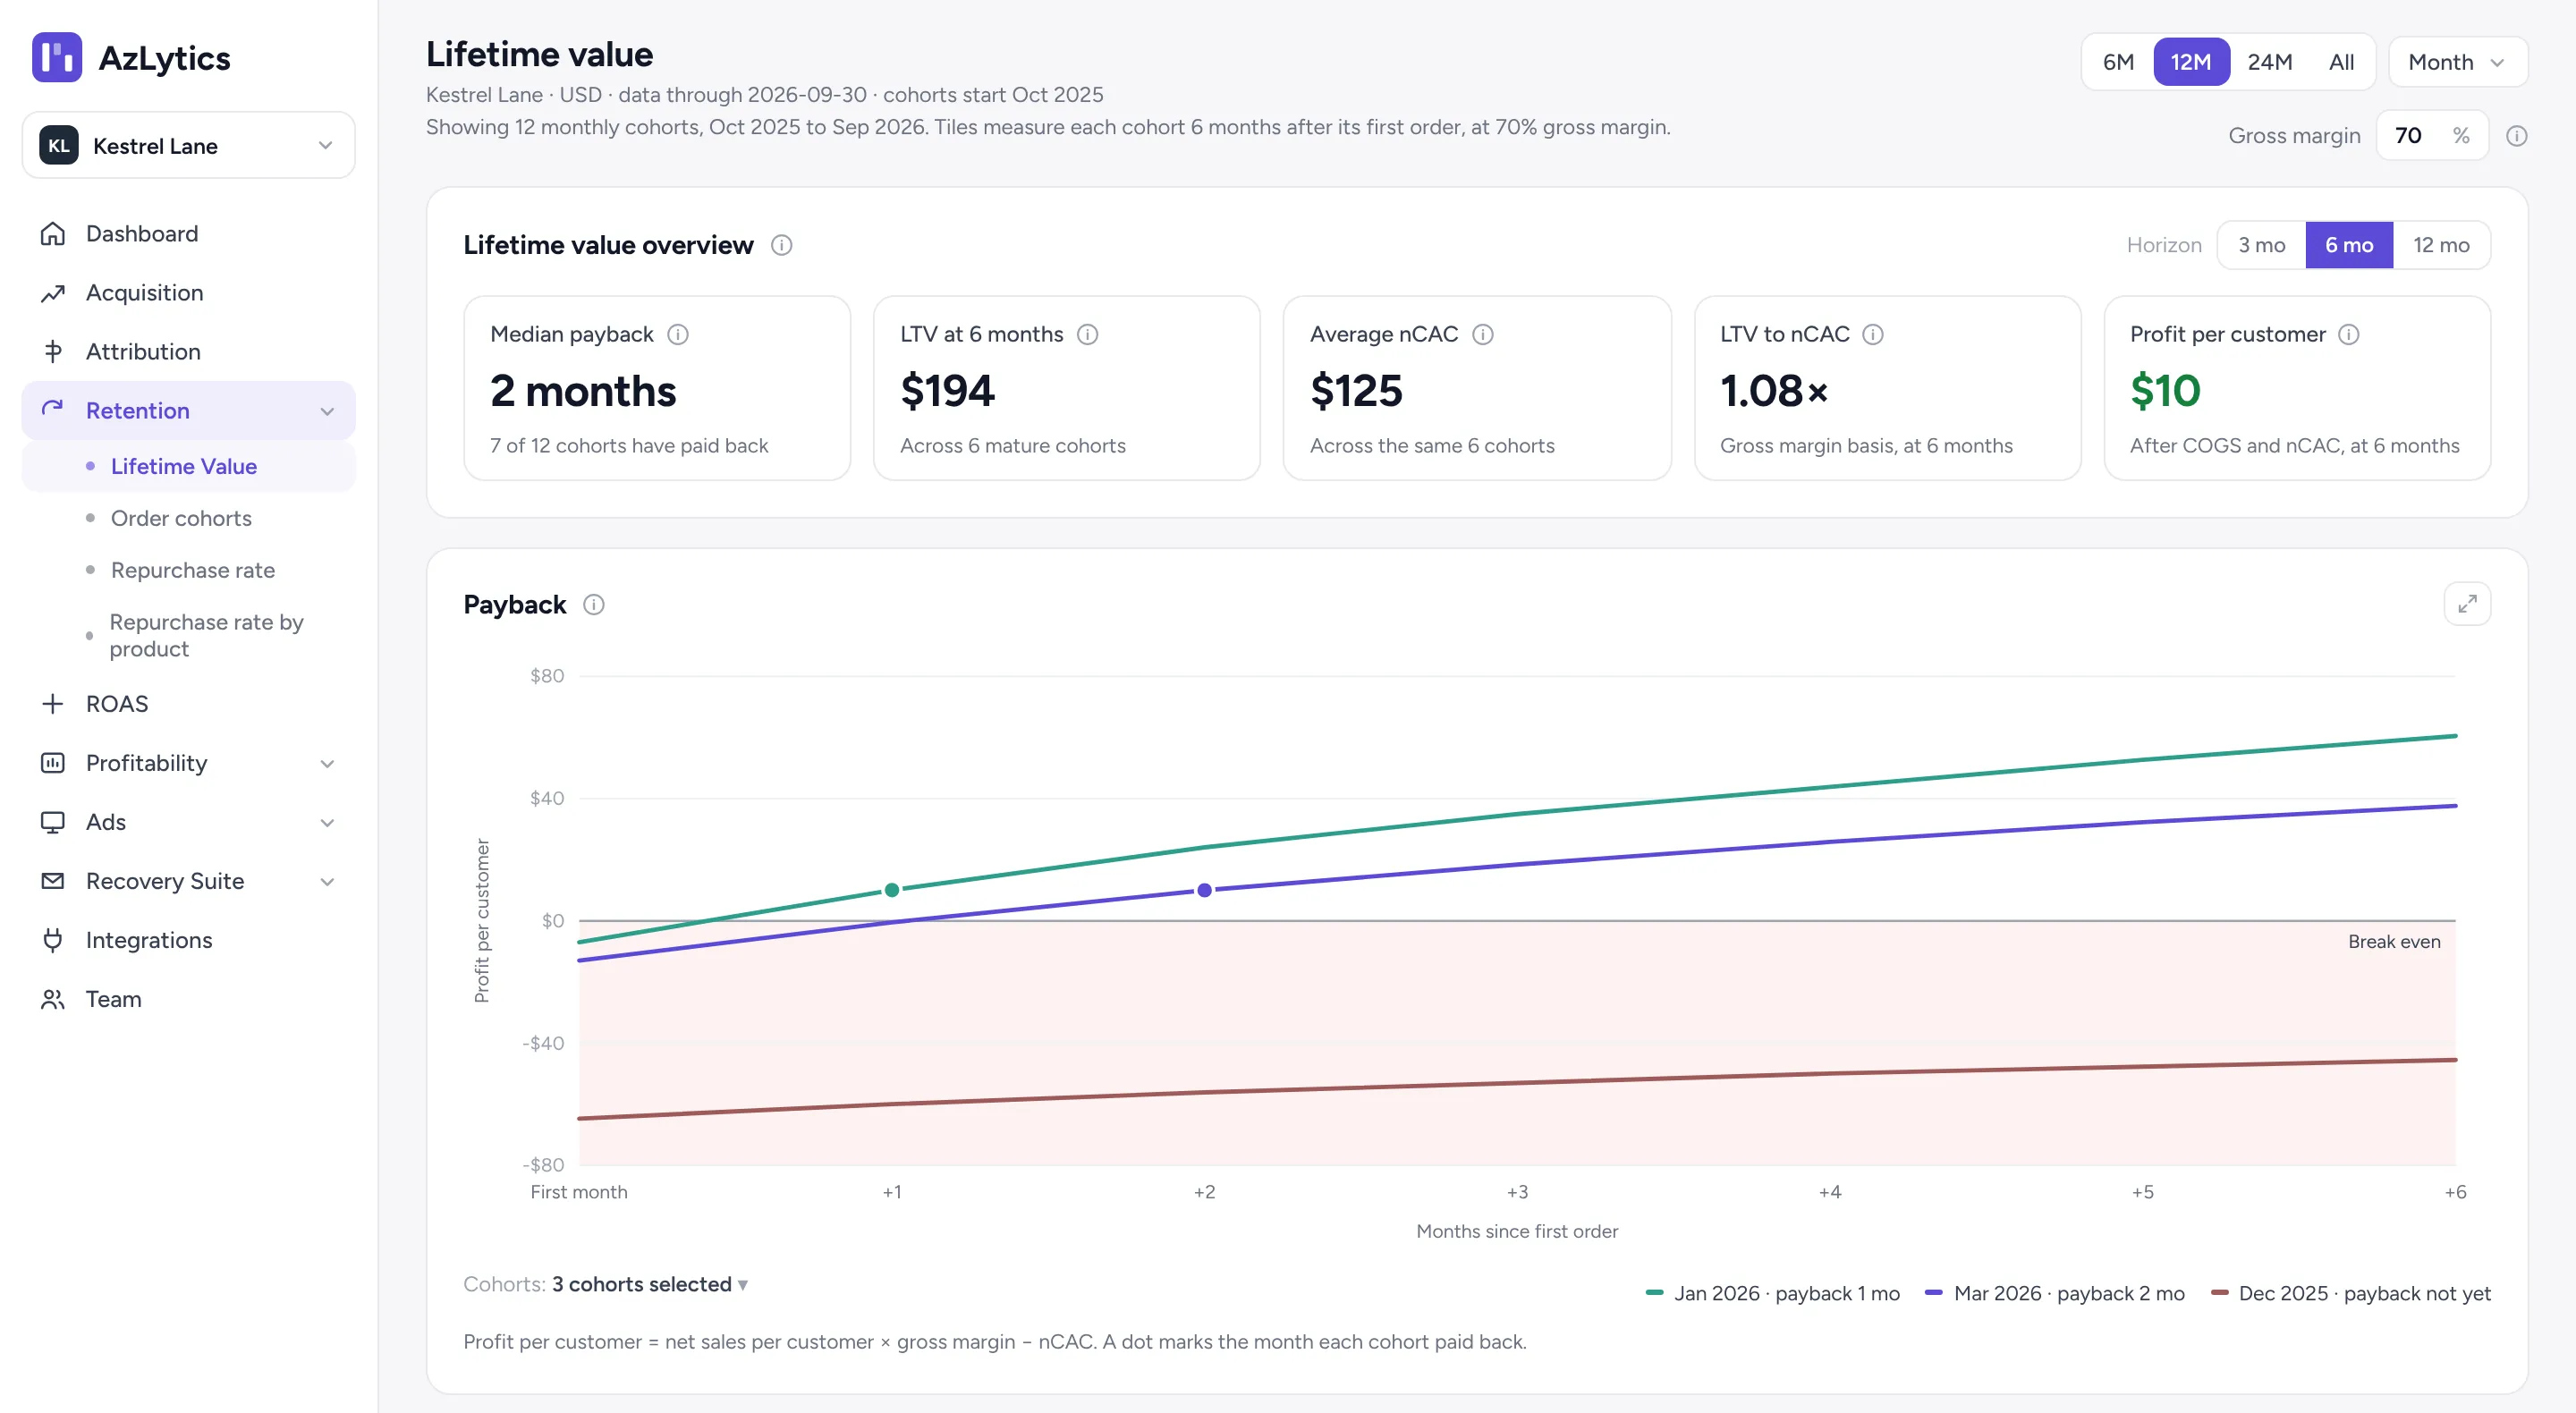
Lifetime value for every month of new customers, after product costs and what you paid to win them. See which months bring customers who come back, and how long each group takes to pay you back.
- A payback month for every cohort
- LTV at 3, 6 or 12 months, next to nCAC
- Weak months flagged before you repeat them
- Repurchase rate, order depth and the products that bring people back
30-day free trial · No sales call · No developer · Cancel any time
SOUND FAMILIAR?
You know what a customer costs. Not what they’re worth.
So good ads get cut for looking too expensive, and weak months get repeated.
THE PROBLEM
You judge ads on the first order, so good customers look too expensive.
WITH AZLYTICS
Payback shows the month each group of new customers covered what it cost to win them, after product costs.
THE PROBLEM
Black Friday looked great. Did those buyers ever come back?
WITH AZLYTICS
Every month of first orders gets its own row, so a weak month stands out at a glance.
THE PROBLEM
One LTV number for every customer you ever had.
WITH AZLYTICS
Each cohort is measured the same number of months after its first order, so months are compared fairly.
HOW PAYBACK WORKS
See the month new customers pay you back.
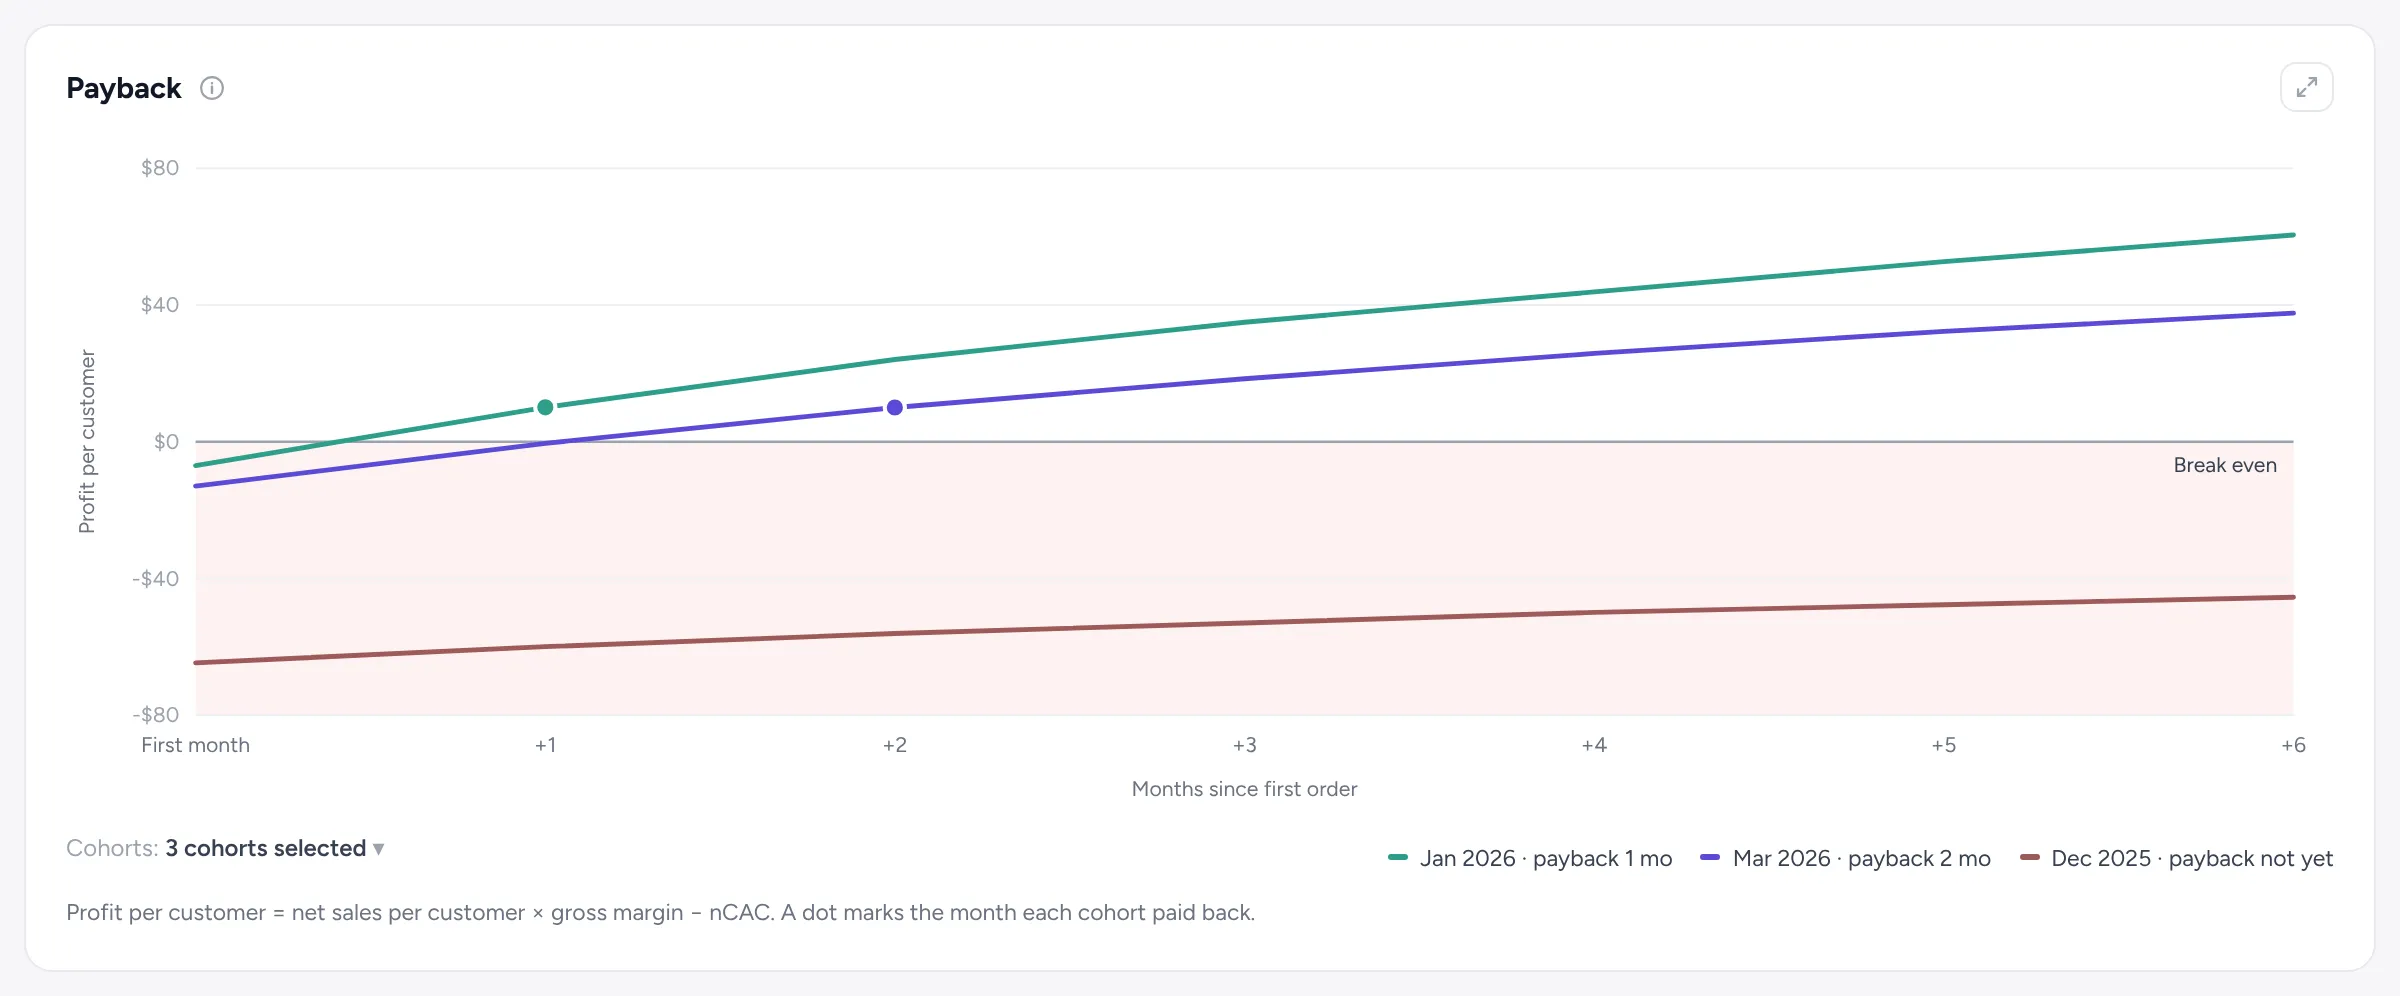
For each month of new customers, AzLytics adds up what they spend, keeps your gross margin and takes away what it cost to win them. Where the line crosses zero, that group has paid you back.
Below the line, that month’s customers still owe you. Above it, they’ve paid for themselves.
Profit per customer
Net sales per customer × gross margin − nCAC
COHORTS
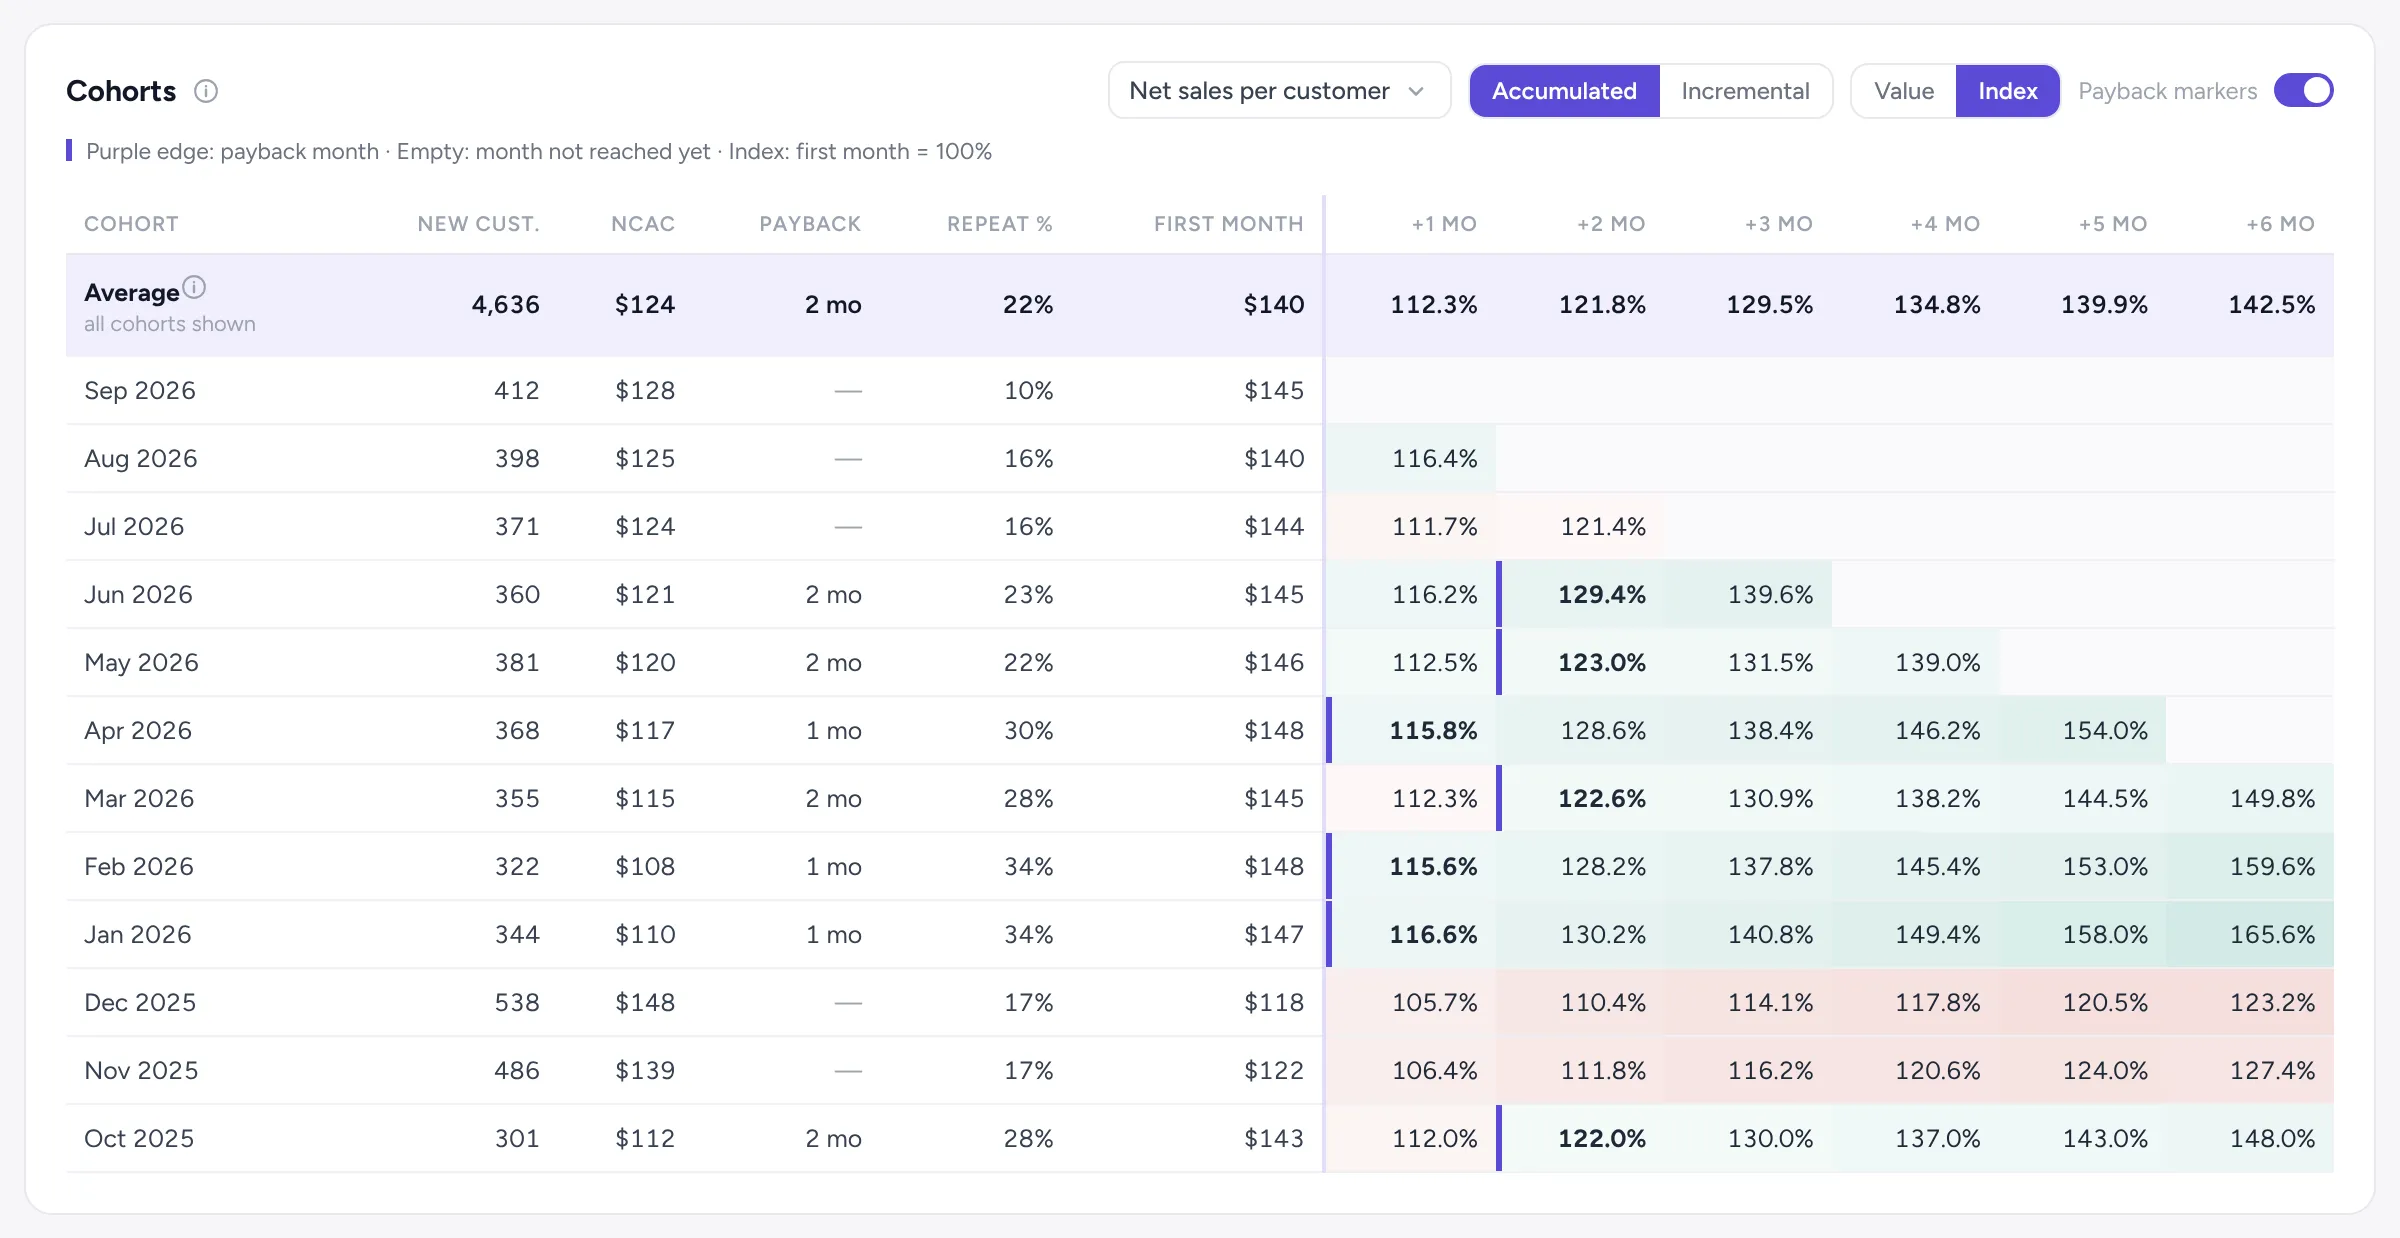
Compare every month’s customers side by side.
One row per month of first orders: new customers, nCAC, payback month and repeat rate, then how much more they spend in each month after. Switch between running totals and month by month, dollars and index.
WHAT MOVES LTV
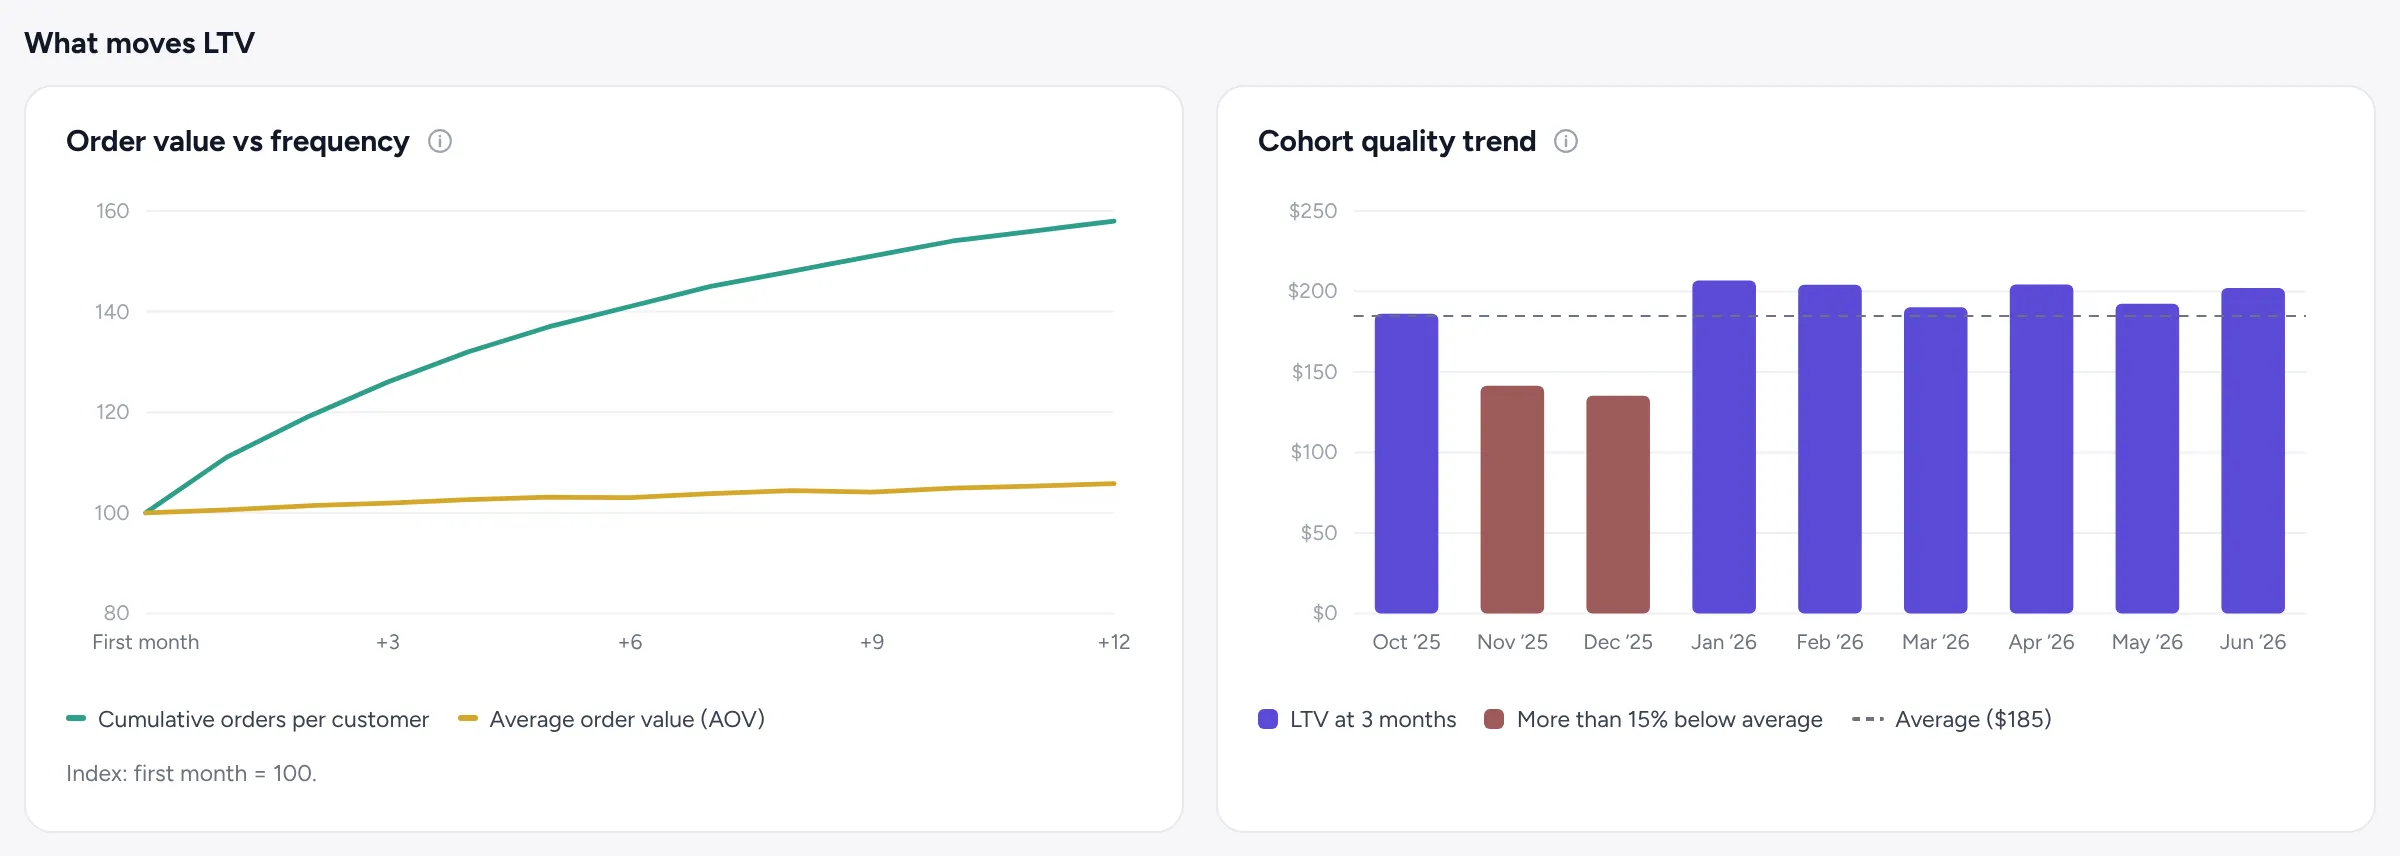
Find out why lifetime value moved.
Is it more orders, or bigger orders? One chart shows which is doing the work. Another shows lifetime value at 3 months for each cohort, with the weak months flagged.
THE NUMBERS
Five numbers for your next budget call.
Measured at 3, 6 or 12 months after the first order. You choose.
Median payback
How many months a typical cohort takes to pay you back.
LTV
What a customer spends in their first 3, 6 or 12 months.
Average nCAC
What you paid for each new customer: marketing spend ÷ new customers.
LTV to nCAC
How many times a customer’s gross profit covers what they cost.
Profit per customer
What’s left after product costs and what you paid to win them.
ALSO IN RETENTION
Who comes back, how often, and why.
Three more views, from the same Shopify orders.
ORDER COHORTS
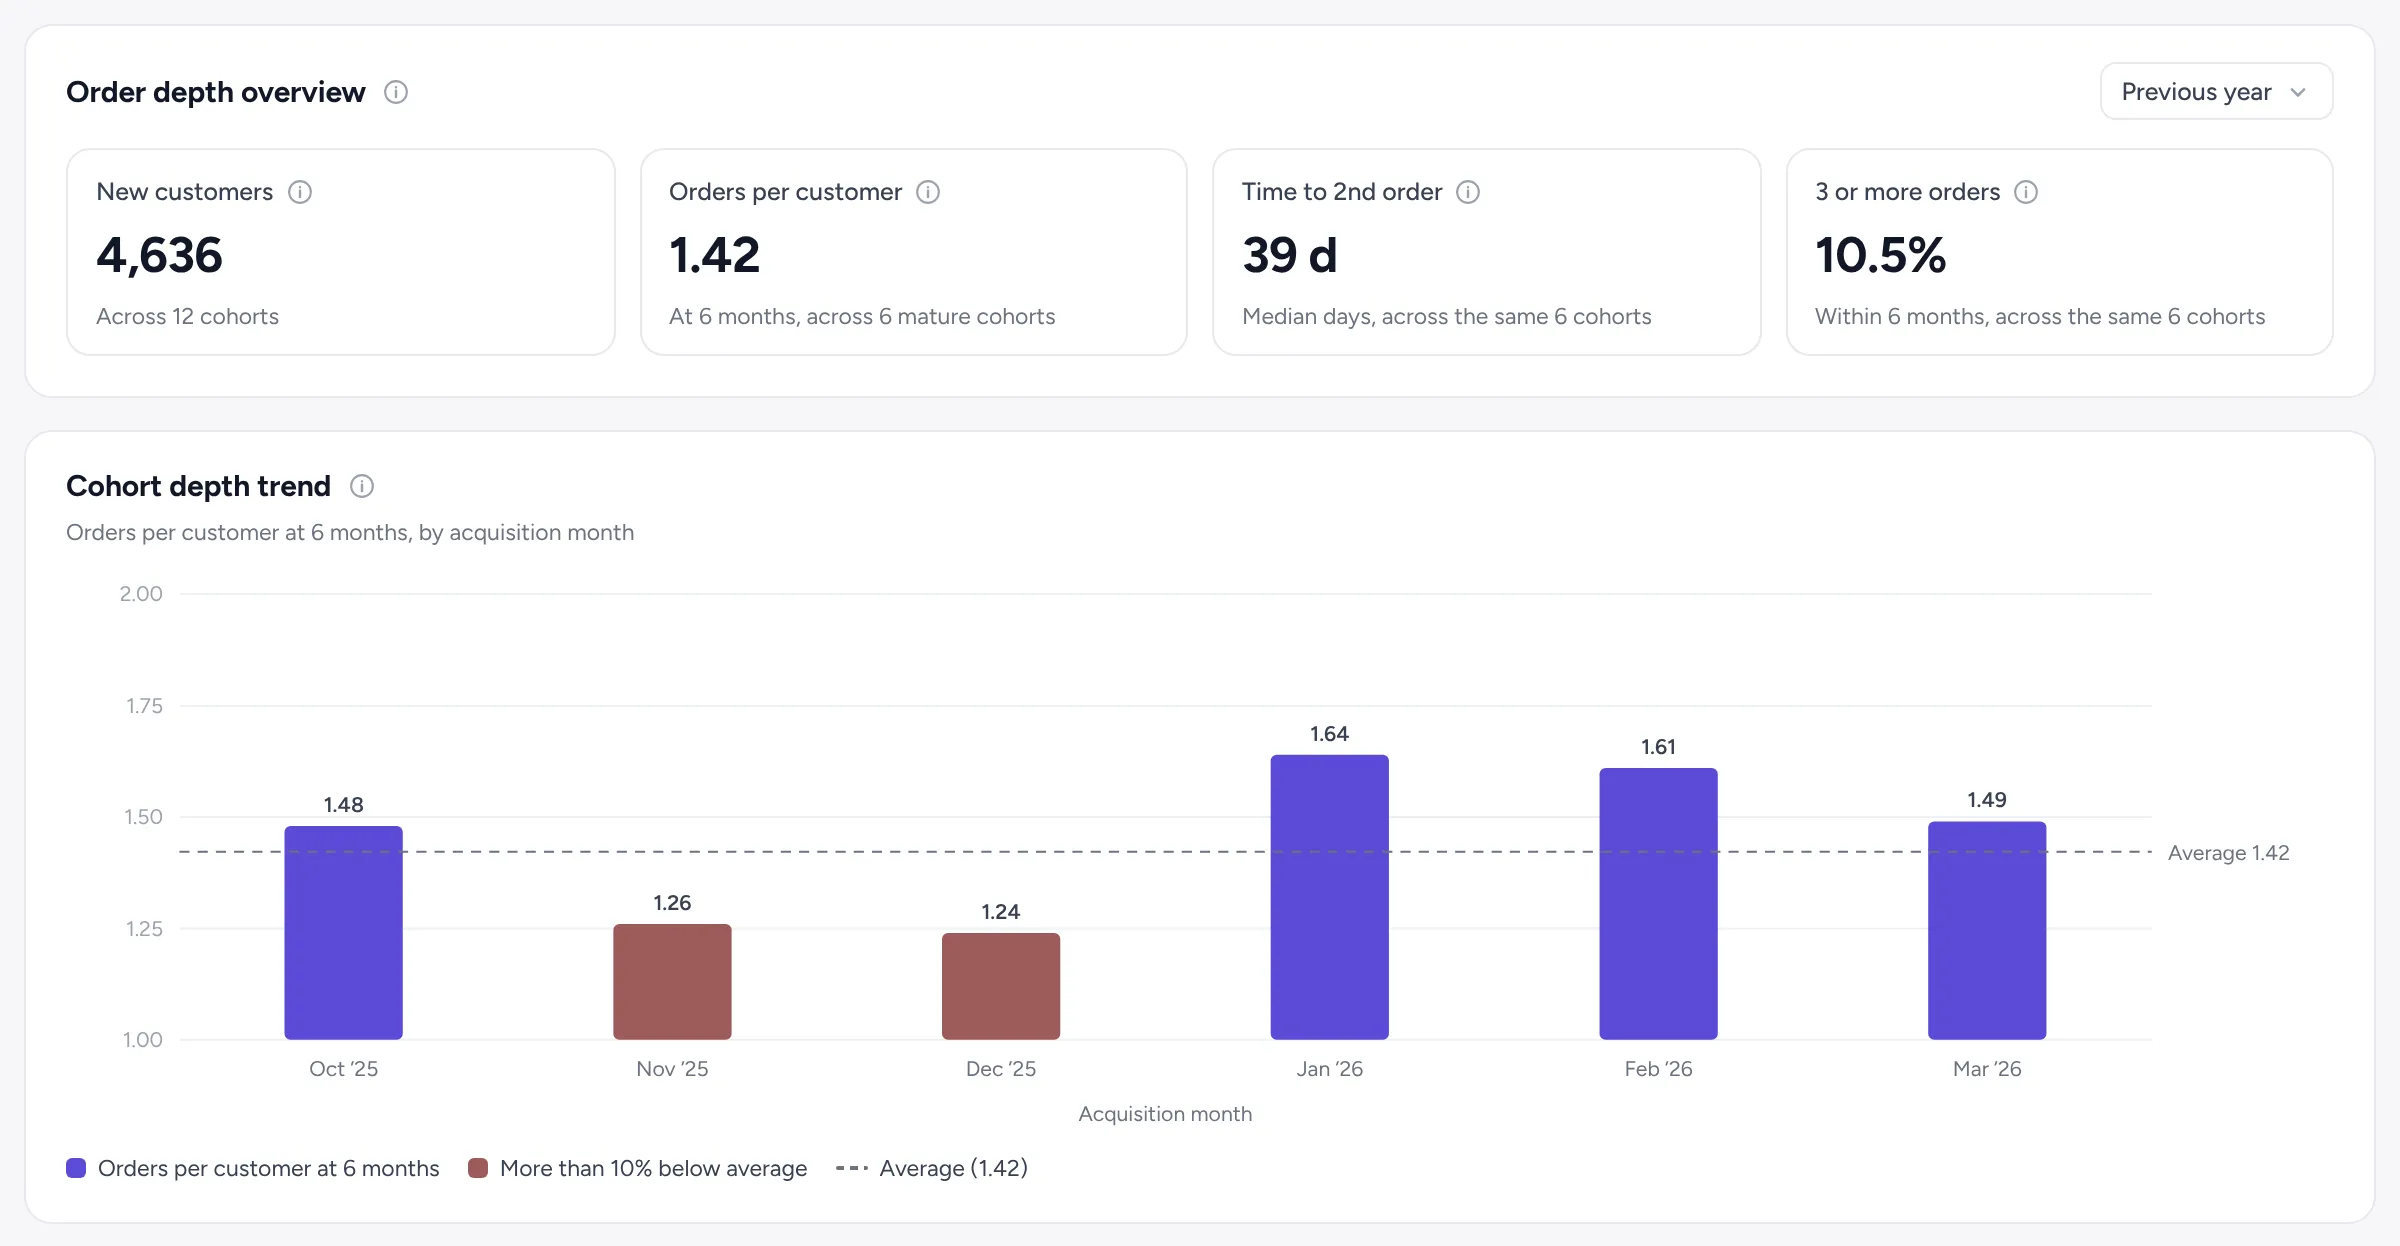
See how many times each month’s customers order.
Orders per customer, days to the second order and the share who reach three or more orders, for every month of new customers. A second table shows what share of each cohort placed a 2nd, 3rd, 4th, 5th and 6th order.
REPURCHASE RATE
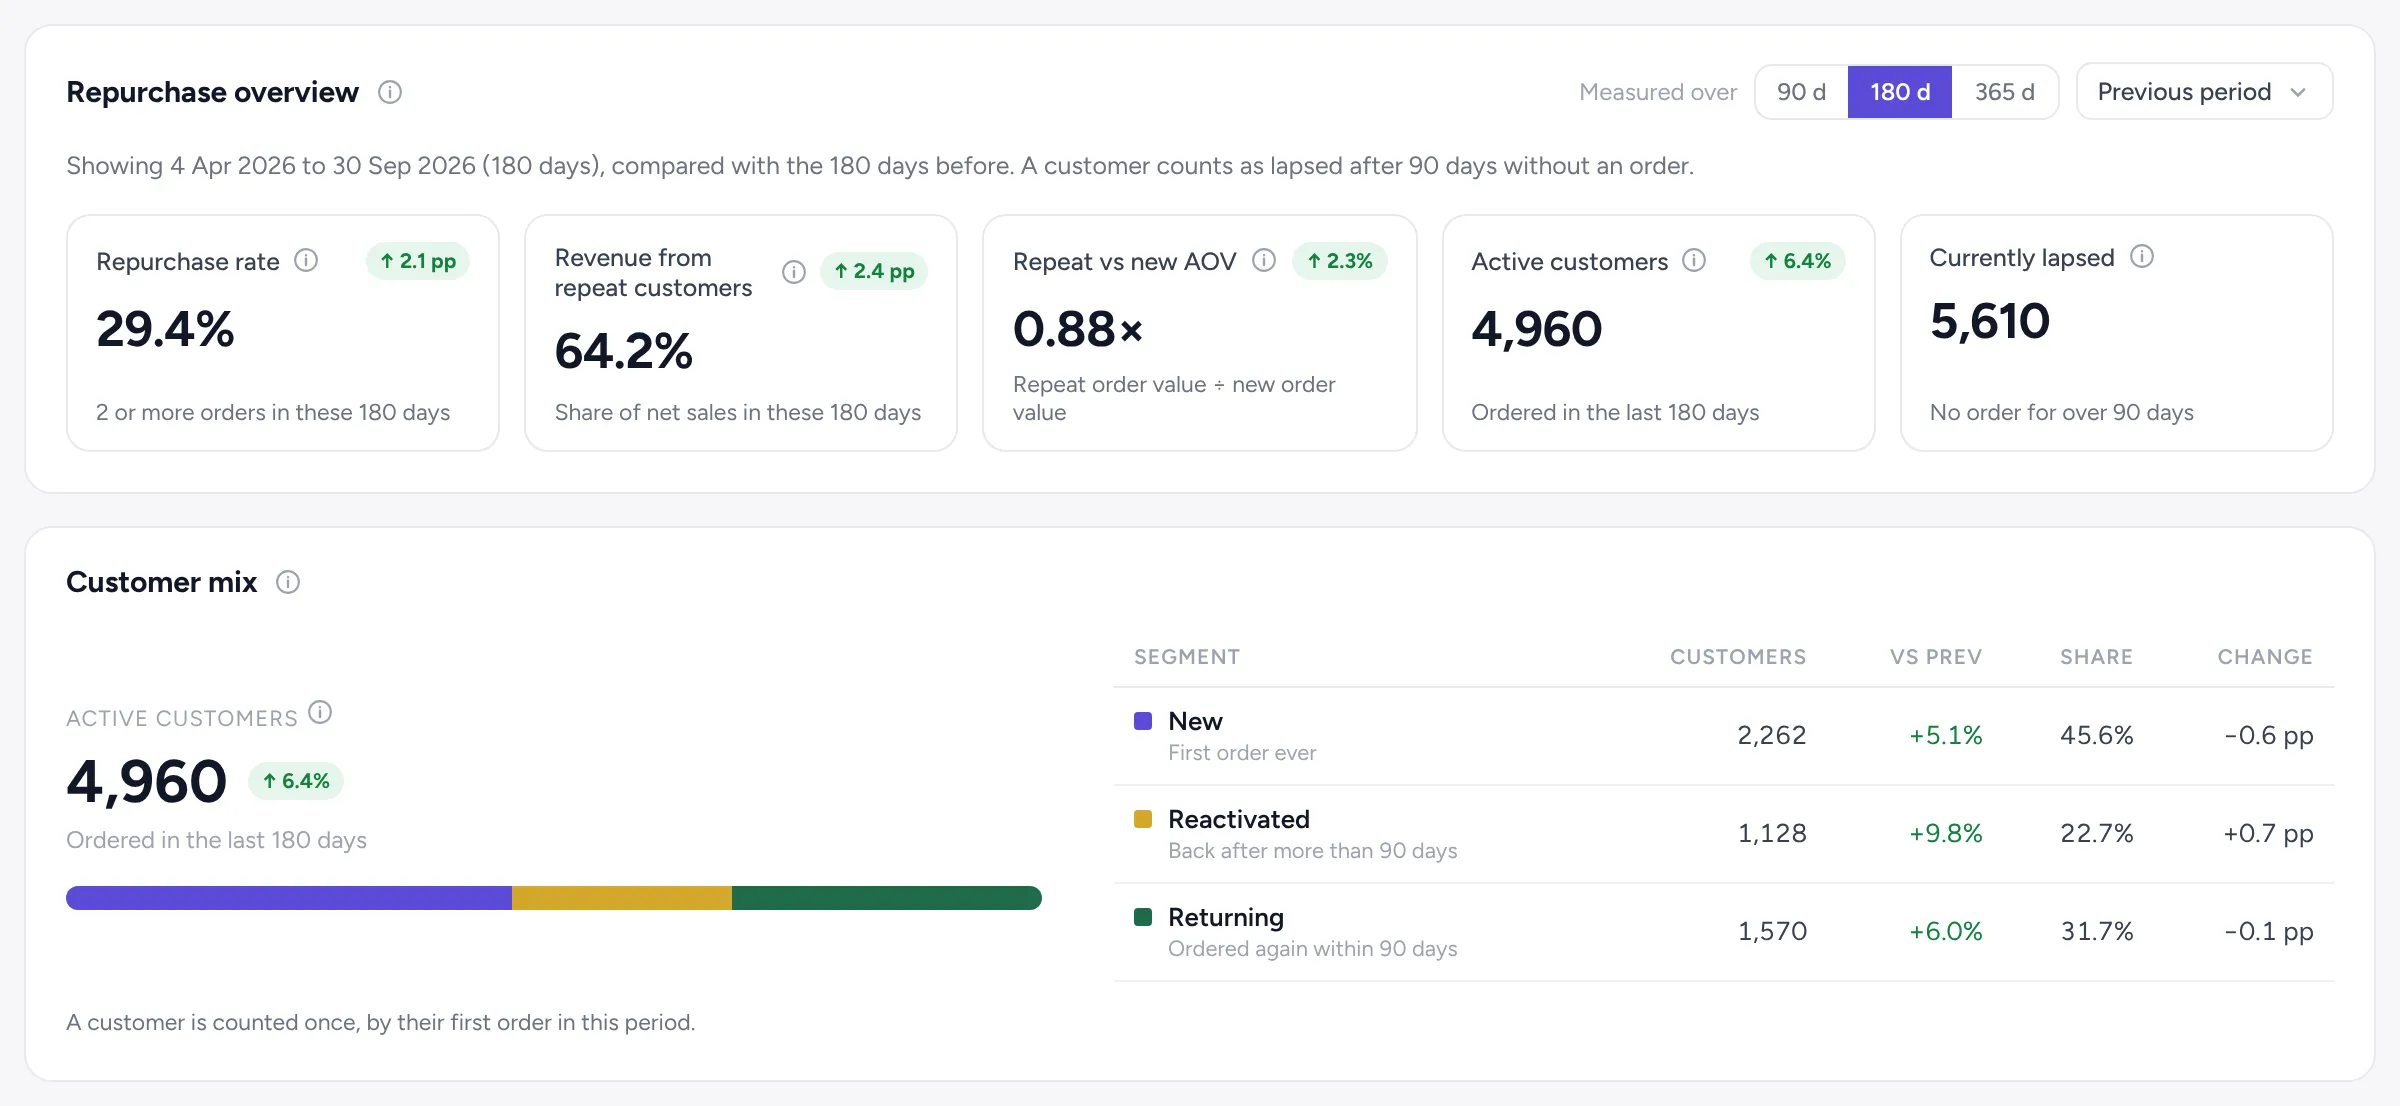
Know who’s active, who’s slipping and who came back.
Your repurchase rate and the share of sales from repeat customers, against the previous period. Every active customer counts as new, reactivated or returning, and you choose after how many days a customer counts as lapsed.
See how many lapsed customers came back, and how many step up from a 1st to a 6th order.
REPURCHASE RATE BY PRODUCT
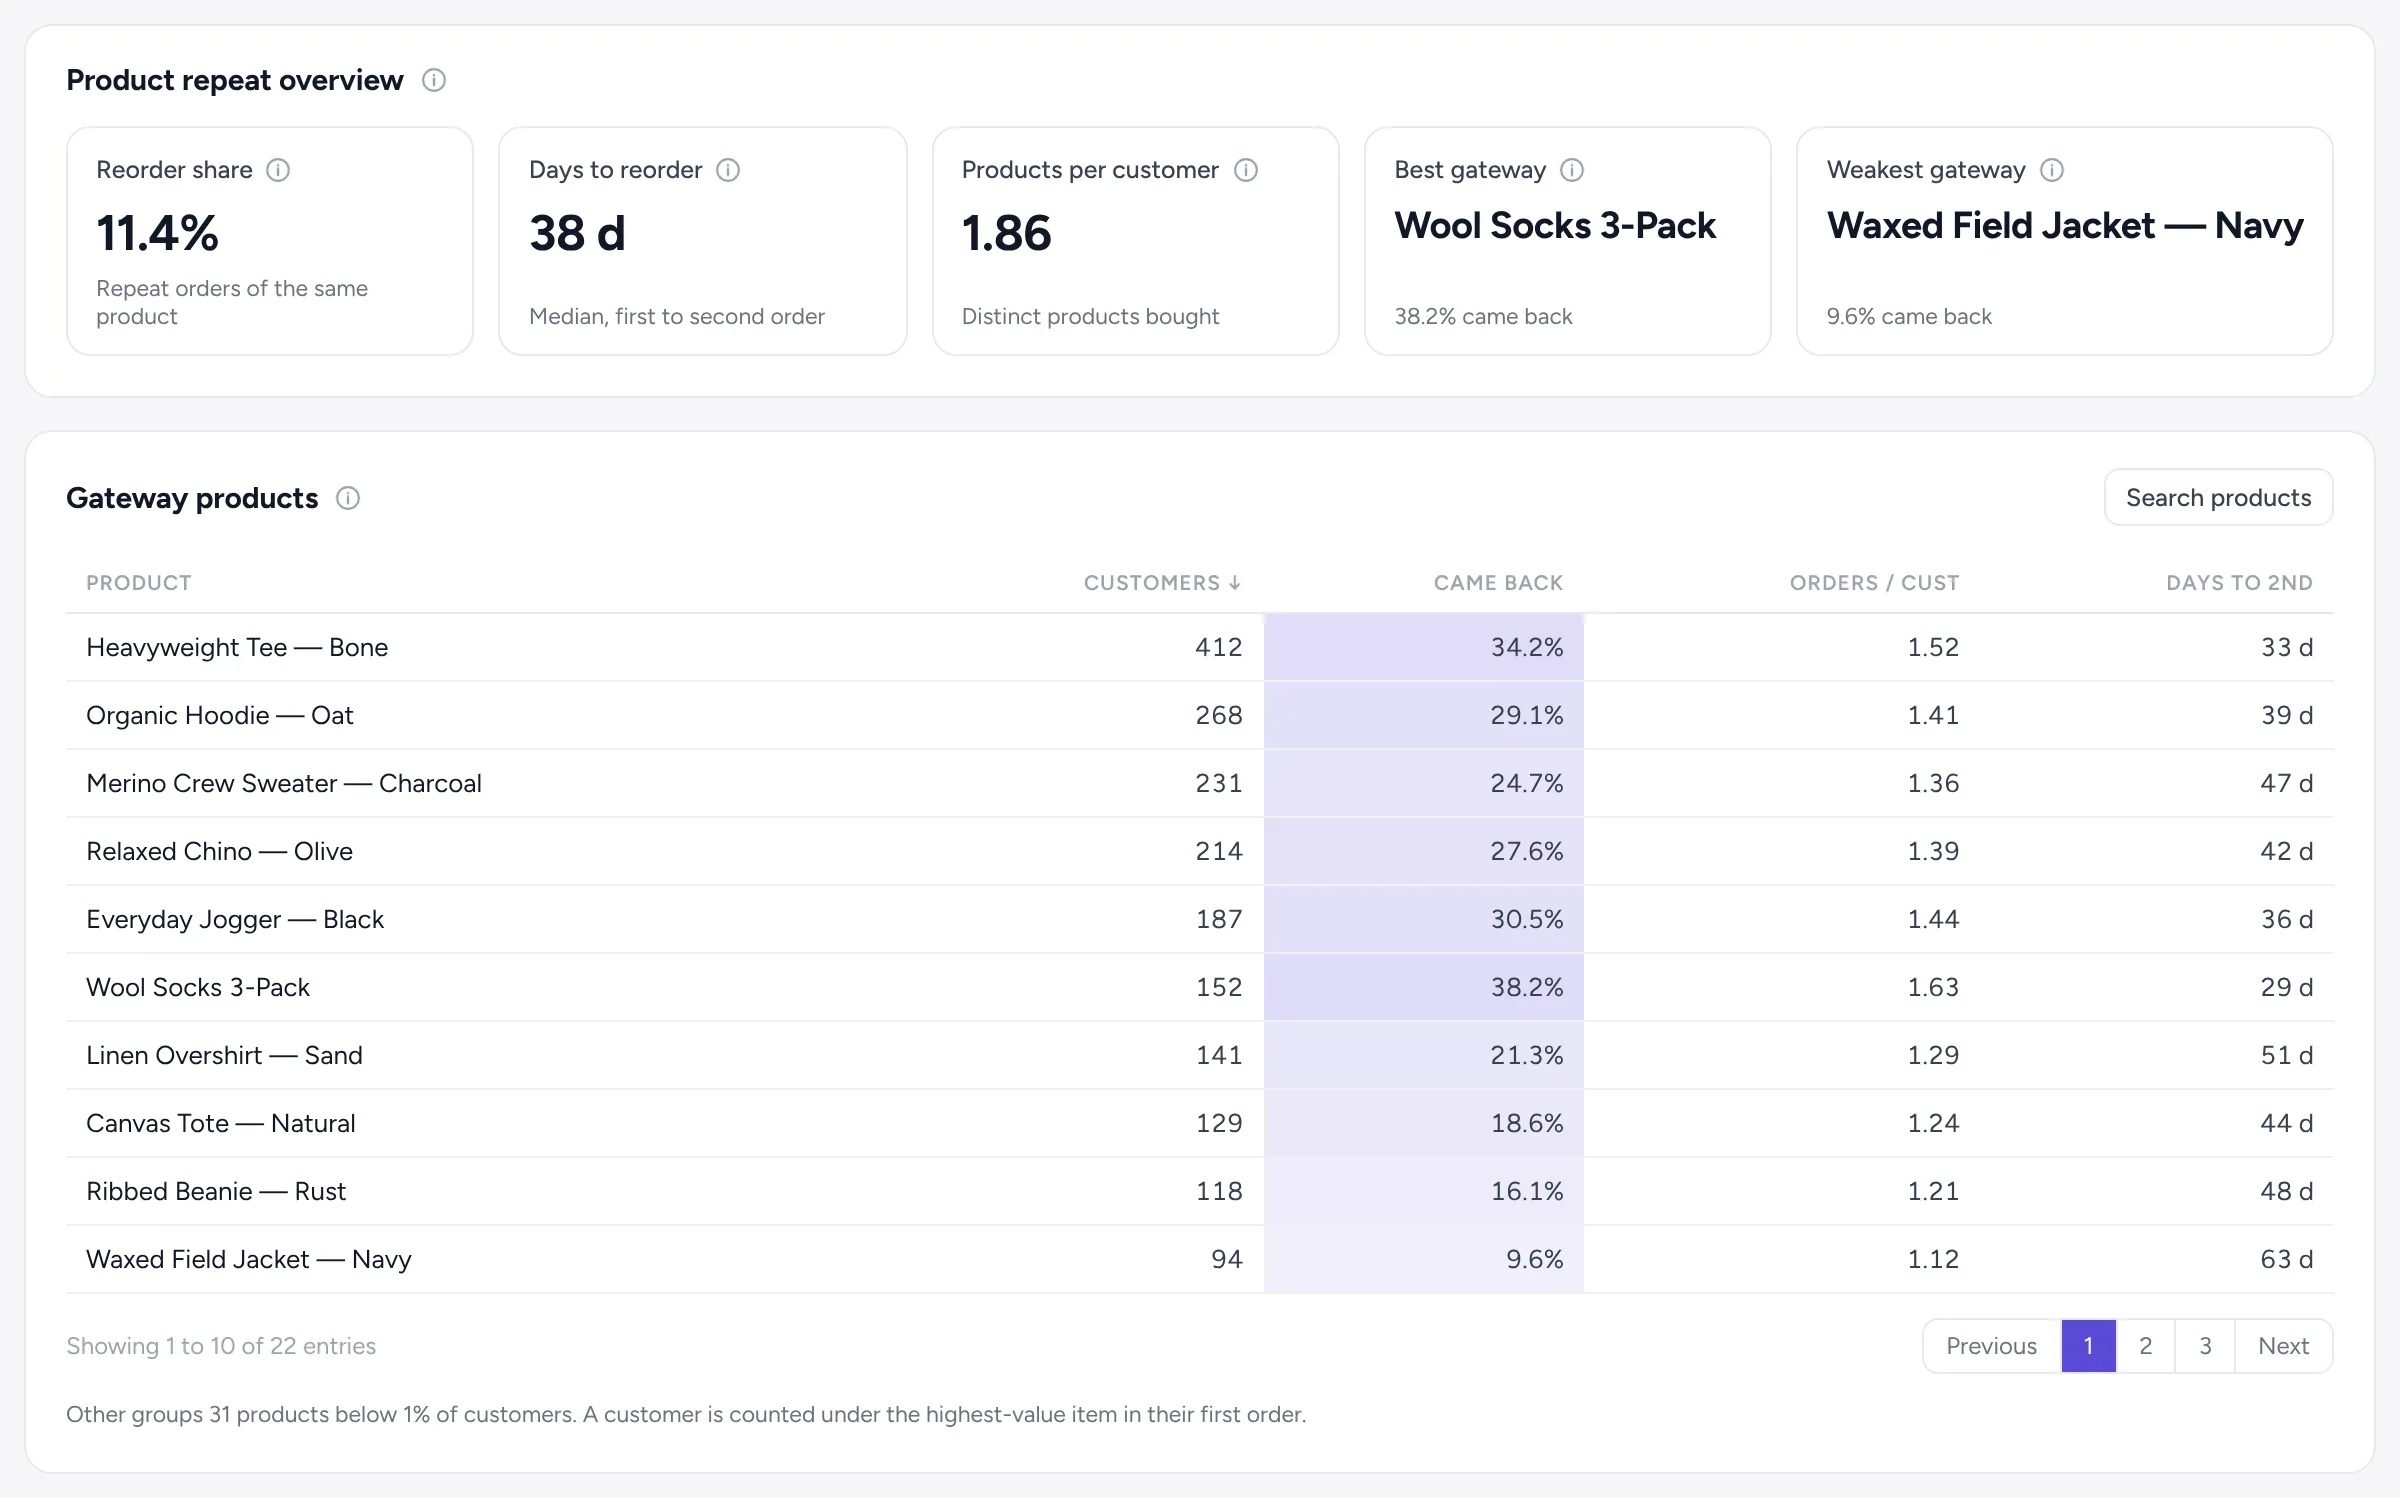
Find the first product that brings people back.
For each product that starts a customer’s first order: how many came back, how many orders they placed and how long the second order took.
Pick a first product to see what those customers buy next, and whether they reorder the same item or buy something different.
Retention questions
What is customer lifetime value (LTV)?
What a customer spends with you over time. AzLytics measures it for each cohort at 3, 6 or 12 months after the first order, from your Shopify net sales.
What is a cohort?
All customers whose first order was in the same month. Comparing cohorts shows whether newer customers are better or worse than older ones.
How is payback worked out?
Net sales per customer × your gross margin, minus nCAC (marketing spend ÷ new customers). The payback month is the first month that number reaches zero.
Where does the gross margin come from?
You enter it once at the top of the page, and AzLytics remembers it for your store.
What’s the difference between new, reactivated and returning?
New customers placed their first order ever. Reactivated customers came back after more days than your lapsed setting. Returning customers ordered again within it.
What is a gateway product?
The highest-value item in a customer’s first order. Grouping customers by it shows which first products bring people back.
Why are some months empty?
A cohort only shows months that have finished. Empty means not reached yet. It never means zero.
Find the customers who pay you back.
Retention is one of four parts of AzLytics, with Profit, Attribution and Recovery Suite.
Start free trial on Shopify30-day free trial · No sales call · No developer · Cancel any time